
Grid View
The grid view, accessible in a lower tab of the central pane, displays data modeling objects in a tabular layout, as an alternative to the existing ER diagram view, graph view, or hierarchical schema view. It displays modeling objects as rows and their properties as columns. You can configure which columns are visible, then sort, filter, and group. You can even edit some properties directly in the grid, or download a grid report in Excel format.
For advanced bulk edit use cases, for example with vlookups or macros, it is still possible to export to Excel and import from Excel from the Tools menu.
The grid view is available at 3 levels:
- the model grid, which lists the modeling objects of the entire model;
- each diagram view grid, which lists the modeling objects of the selected ERDV;
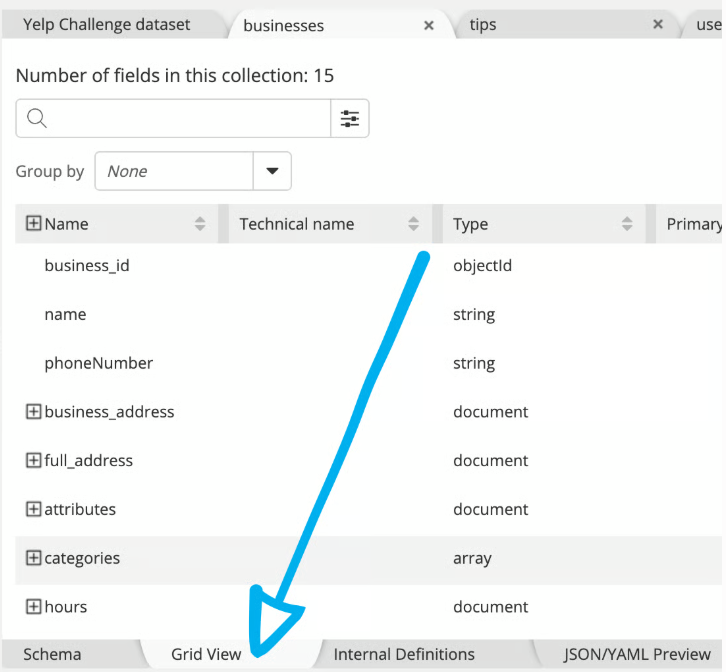
- the entity grid, which lists the attributes of a single entity, when having the entity opened in an upper tab.
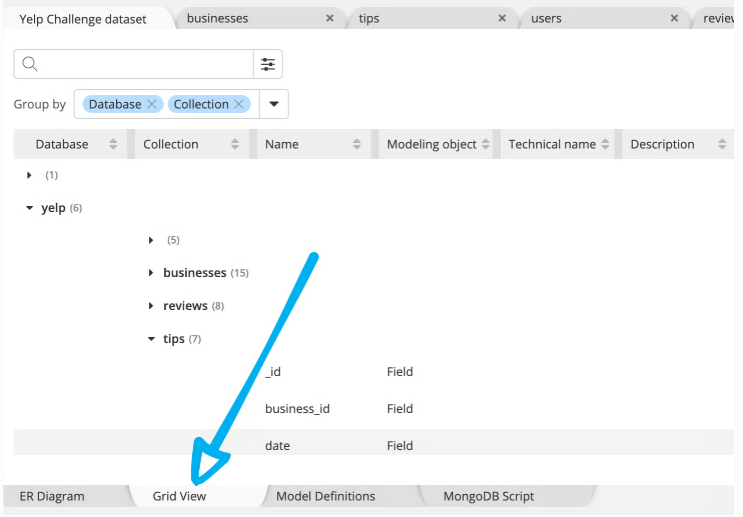
Those grids are accessible via the lower tab "Grid View":
- in second position, right after the ER Diagram tab at model and ERDV level
- in second position, right after the Schema tab at entity level
Both grids share the same behavior for column configuration, sorting, filtering, and grouping. The main difference is the scope of the rows. Behavior specific to the model grid can be found further below.
Grid controls
Many controls are at your disposal to configure the grid to suit your exact needs:
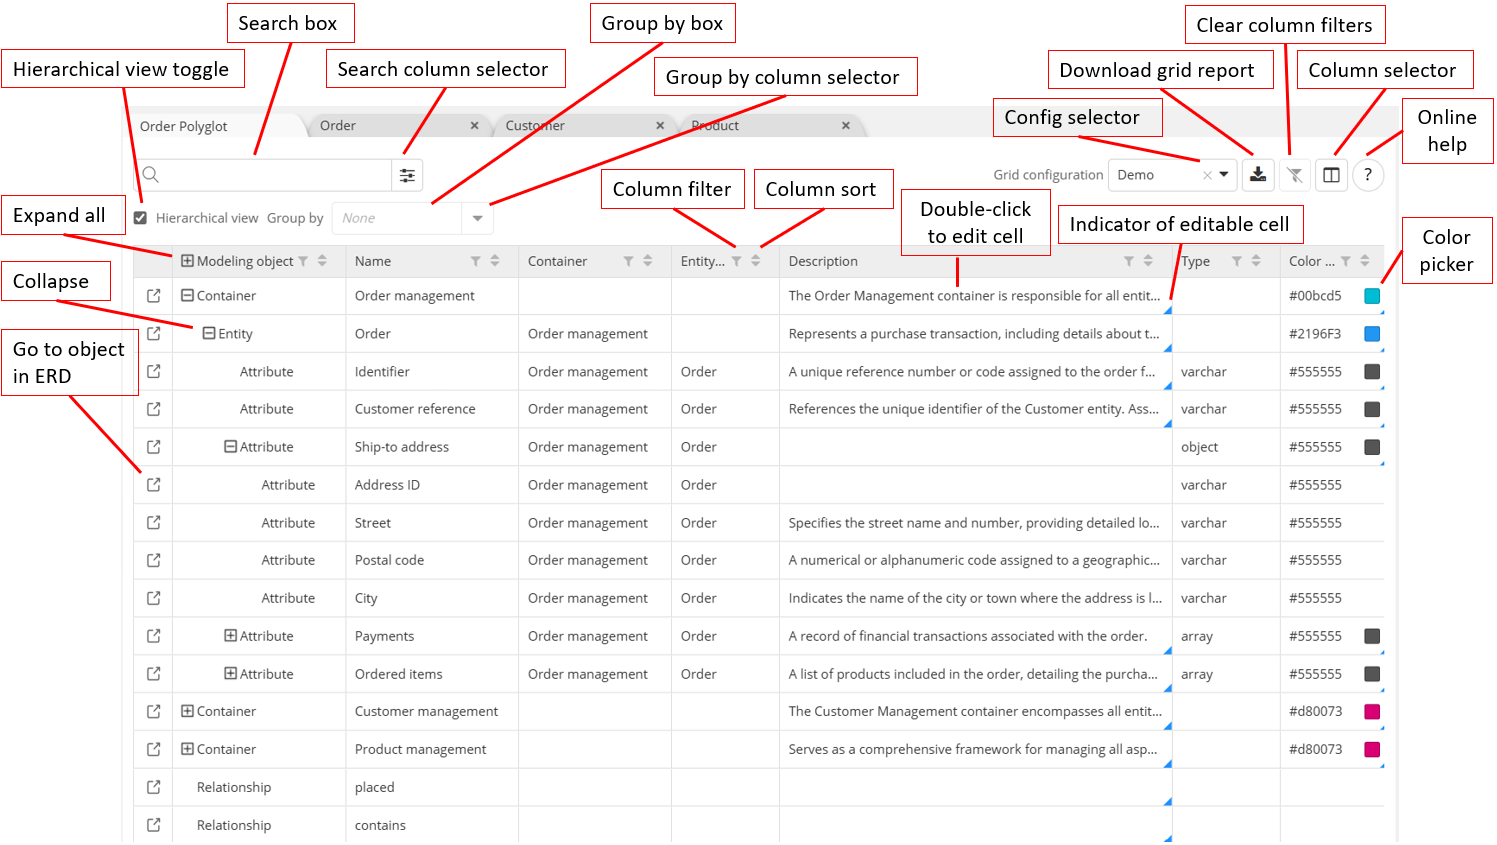
Hierarchical view toggle
This toggle is available only at the model level and ERDV level, i.e. not in entity tab grid views.
By default, the toggle is checked so that the grid is organized with nesting of containers, then entities in containers, then attributes in entities. This structure is fairly similar to the tree in the Object Browser.
If you uncheck the toggle, then the list is takes a natural tabular form.
Note: the Group by control (described below) is disabled in when the hierarchical tree is enabled.
Modeling object column
Because the model grid lists modeling objects of different natures (Containers, Entities, Attributes, etc.), the "Modeling object" column indicates the nature of each row. Currently, the possible values are Container, Entity, Attribute, and View. Relationship and UDT/model definition will appear once these object types are added to the grid.
This column lets you search for a single object type, or group the grid by object type. For example, if all you wish is to display all the columns in all the tables of a relational model, you would simply filter by Modeling object with value column.
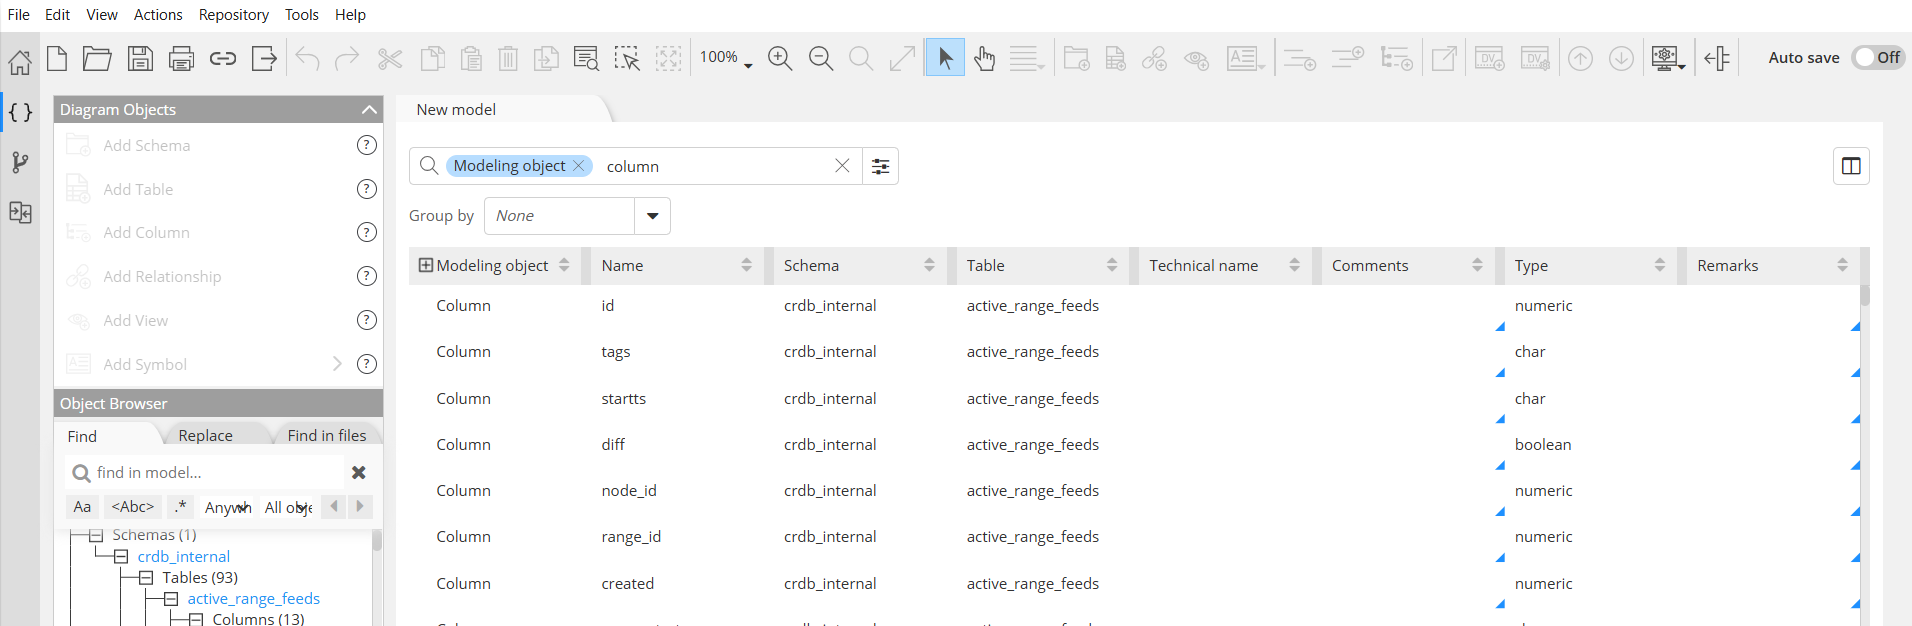
The +/- sign control int he title of the Modeling object column allows your to expand all / collapse the tree.
Container and Entity columns
Two columns describe where each object belongs in the hierarchy:
- Container: the container that the object belongs to, if any. For different targets, this label can be schema, database, namespace, keyspace, resource, etc..
- Entity: the entity that the object belongs to, if relevant. For different targets, this label can be table, collection, node, record, request, etc.
Grid features
Select columns
You can choose which properties appear as columns. Open the column selector from the grid toolbar, then check the properties you want to display, or uncheck them.
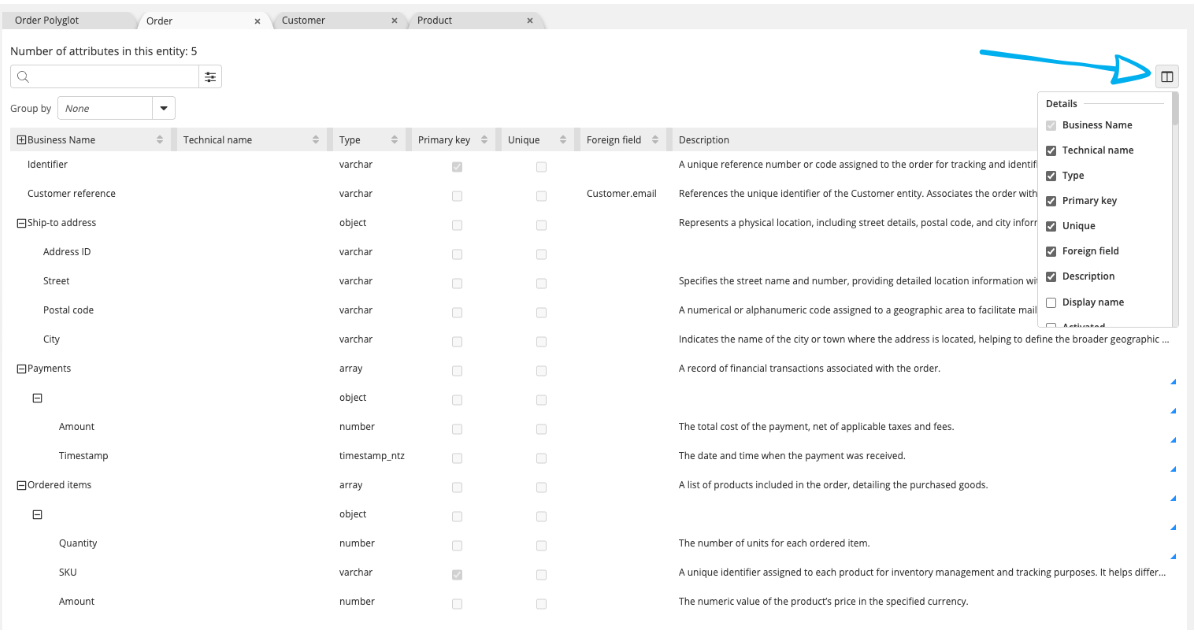
A search box appears at the top of the list to help you locate the desired property to be selected as a column, or deselected. The column list dynamically reacts as you type in the search box.
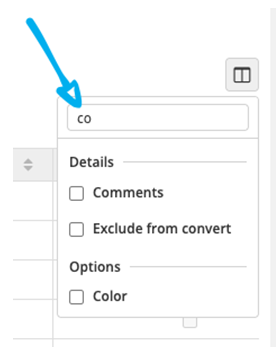
The column selector lists the properties of all the tabs of the properties pane, including custom properties. Some plugin-specific properties are not yet present. The missing ones will be added progressively in upcoming versions.
Reorder columns
You can reorder columns by dragging a column header to a new position.
Resize a column
You can resize a column by dragging the right border of the column header. Or you can maximize its size to the widest content in the column by double-clicking on the right border of the column header.
Filter content of a column
Column filters let you narrow the grid by applying criteria to one or more columns. Within a single column, selecting multiple values works as an OR condition, for example Status = Open OR Pending. Across different columns, filters are combined as an AND condition, for example:
Entity = Customer OR Product
AND Type = string
AND Activated = true
So the displayed rows must satisfy the filter criteria in every filtered column.
You may clear an individual column filter within the filter box for that column, or clear all filters with the button in the top right corner of the grid (second button from the right.)
Sort rows of a column
Click the up/down arrow icons towards the right of a column header to sort the grid rows in ascending order of content in that column. Click again to reverse the order. Click one more time to disable the sort for the column.
Select a row to display the Properties Pane of the object
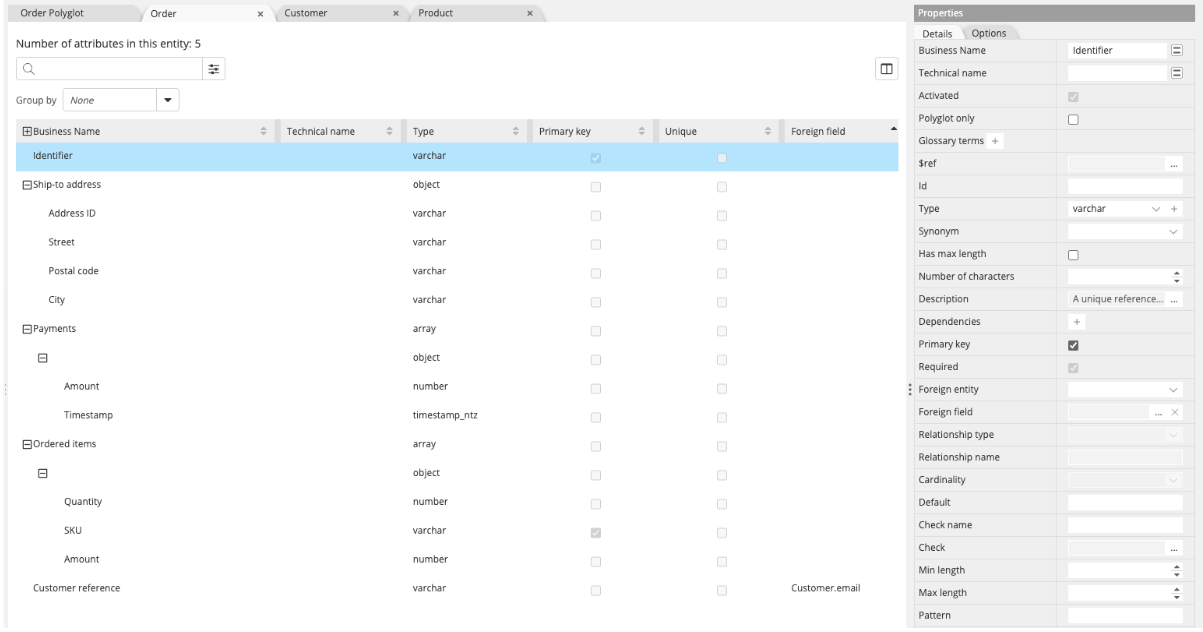
A single click on any cell selects the corresponding row and shows its details in the Properties Pane, allowing you to edit the properties in the Properties Pane, just as you would in the ER diagram or Object Browser.
Go to object in ERD
There is, to the left of each row in the grid, an icon to jump directly to the corresponding object in the ER diagram, or diagram view.
Edit directly in the grid
Some cells can be edited directly in the grid without opening the Properties Pane. Editable cells are noticeable by the blue triangle in the bottom-right corner of the cell. Double-click the cell to switch it to edit mode, type your text, then press Enter or click outside the cell to save. Press Escape to cancel. For multi-line text, the same convention is used as in Excel: insertion of line breaks in textarea cells during inline editing uses Alt+Enter (Windows) or Option or Shift+Enter (macOS)

Note: currently, inline editing is available on some text area properties, as e.g. the Description, the Comments, and the Color properties. More properties editing will be enabled in upcoming releases.
Copy/paste to multiple cells
It is of course possible, for editable cells, to copy or paste content, using the keyboard shortcuts Ctrl/Cmd+C (copy) and Ctrl/Cmd+V (Paste.)
It is even possible to paste to multiple cells in the grid. After having copied content to your clipboard, simply use the multi-select keyboard shortcuts of Shift+mouse click (for contiguous cells) and/or Ctrl/Cmd+mouse click for non-contiguous cells, then Ctrl/Cmd+V to paste.
Search
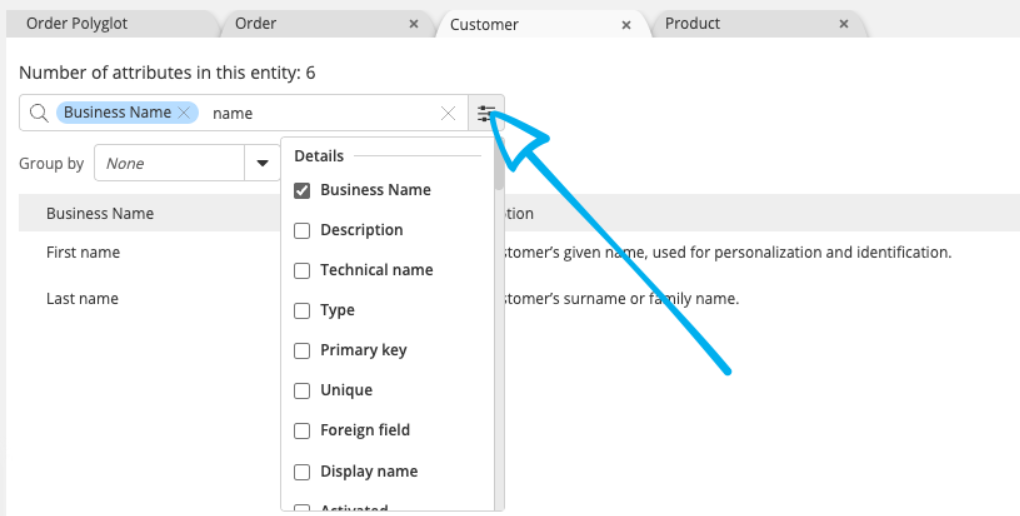
Use the search field above the grid to restrict the rows to find values in the grid matching your text. This is a global search. By default, it searches across the columns checked in the selector: any row that contains your text in any of the selected columns stays visible. A Search box appears at the top of the list to help you locate the desired property to be selected as a search, or deselected.
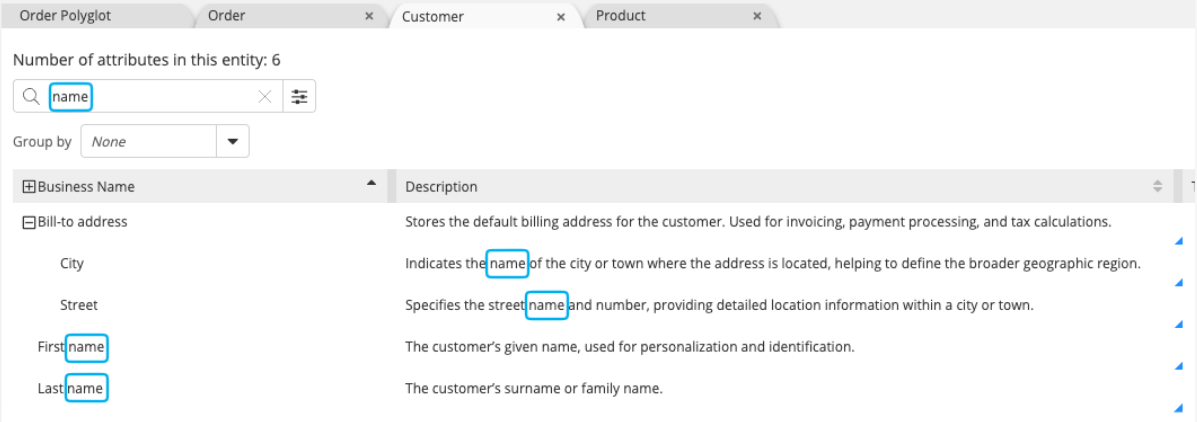
You can also restrict the search to a specific column. Select the column(s) you want to search on, the the value you are searching for, then the filter applies only to those column(s).
Note: for very large grids, the search across all selected columns can become too heavy for the engine. The limit is based on the number of cells to search, that is the number of rows multiplied by the number of searched columns. When the total number of cells exceeds 500,000 cells, the global search becomes a targeted search: you must identify the columns in which you want to search, so that the search stays under the 500k cells limit. In practice, on a very large grid, you should configure a few columns (around four or five -- that would allow for 110+ rows...) so that the search runs on those only. Below the limit, the search applies to all the selected columns.
Group
The group by feature regroups the rows under collapsible nodes, based on the values of one or more columns. A Search box appears at the top of the list to help you locate the desired property to be selected as a group, or deselected.
To group the grid, add a column to the group by field by:
- selecting it in the dropdown
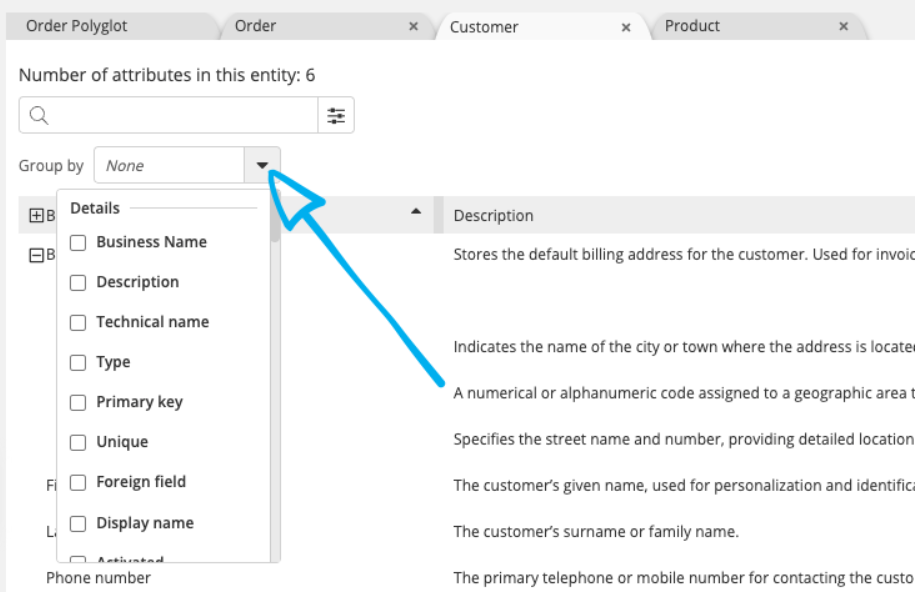
- or by dragging and dropping a column header into the group-by zone.

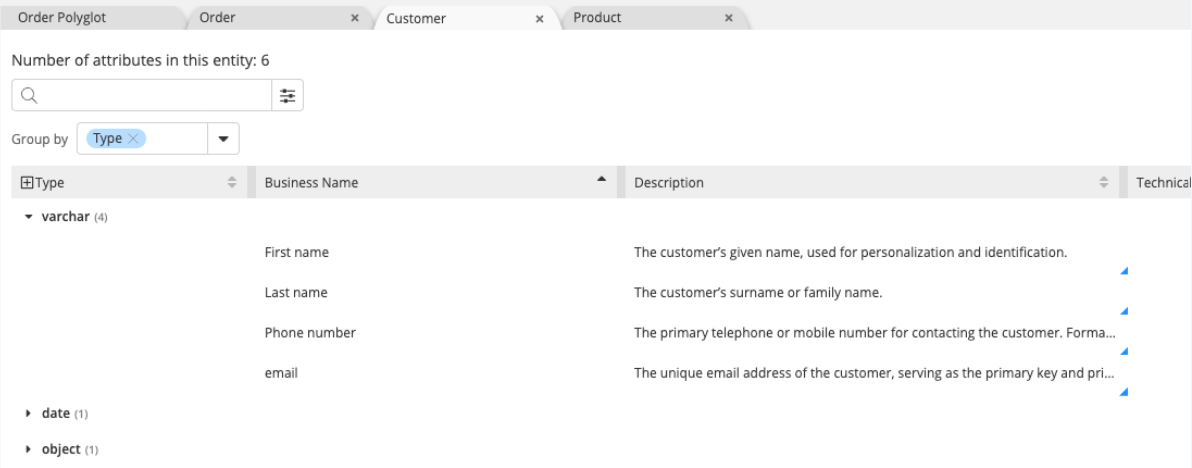
You can group by several columns. The order of the columns defines the grouping hierarchy: the first column is the outer group, and the next columns are nested inside. You can reorder the columns inside the group by field by dragging them. The grouping updates immediately to reflect the new order.
Each group node can be expanded or collapsed. The number of rows grouped under a node is indicated between brackets.
Download grid report
This button, 3rd from the right in the top right corner of the grid allows to generate a report in Excel for the exact selection of the grid, as configured on screen: column selection, column order, column sort, filters, group by, etc
The report is saved in Excel .xlsx format.
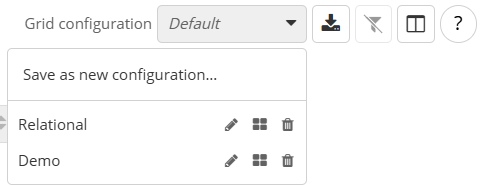
Grid configuration
After careful defining a grid view, it is natural that you would want to save that configuration for future use. The grid configuration defines how a grid looks and what it displays. It applies to two distinct grid types, each with its own independent configuration:
- Entity grid: displays the attributes of a single entity
- ERD(V) grid: consolidated grid displaying all objects across the model (containers, entities, attributes, relationships...)
Grid configuration is split into two parts: structure and content display:
-
structure defines how the grid is organized visually, including the following parameters:
- column visibility
- column order
- column width
- grouping
-
content display defines what is shown and how rows are presented, including the following parameters:
- filtering
- sorting
- expansion state
Except for whether the hierarchy is expanded or not, all other parameters are part of configuration, and therefore can be saved, so it can be reused at a later time.
It is possible to save multiple configurations for a grid, give each a name, rename them after the fact, save a config as a new name (to make a small variations), or delete them. Each grid for the main ERD, for each Diagram View, and for each entity has its own configuration. But it is also possible to apply a selected configuration to all the ERD and Diagram Vies of a model. Or to apply a selected configuration to all entities in a model.